EduML: Student Success Predictor
An End-to-End Machine Learning Implementation for Educational Analytics
By MOHAMMAD AFROZ ALI
Table of Contents
- About Me
- Introduction
- Project Overview
- Exploratory Data Analysis (EDA)
- Data Ingestion
- Data Validation
- Data Transformation
- Model Training & Hyperparameter Tuning
- Model Evaluation
- Experiment Tracking
- Deployment
- Docker Containerization
- CI/CD Pipeline
- Cloud Deployment (Azure)
- Conclusion
- Skills Showcased
- GitHub & Contact Details
About Me
MOHAMMAD AFROZ ALI
Aspiring SDE, AIML Intern
Education
Final Semester B.Tech (Information Technology) - 8.0/10 CGPA
Muffakham Jah College of Engineering & Technology
Focus Areas
- AI/ML
- Software Engineering
- Cloud Technologies
Interests
Keen on Artificial Intelligence & Machine Learning
Focus on building end-to-end solutions that combine ML with software engineering best practices
Technical Proficiency
Introduction
Educational institutions constantly strive to understand the factors affecting student performance to enhance teaching strategies and provide targeted support. This project delivers an end-to-end machine learning solution to analyze and predict student performance based on various demographic and educational factors.
Project Motivation
Many factors can influence a student's academic performance, from socioeconomic status to study habits. With machine learning, we can identify which factors have the strongest impact on student success and build predictive models that help educators proactively support students who may be at risk of underperforming.
Dataset Information
The project utilizes the "Student Performance in Exams" dataset with 1000 records and the following features:
| Feature | Description | Type |
|---|---|---|
| gender | Student's gender (male/female) | Categorical |
| race_ethnicity | Ethnicity group (A through E) | Categorical |
| parental_level_of_education | Highest education level of parents | Categorical |
| lunch | Lunch type (standard/free/reduced) | Categorical |
| test_preparation_course | Whether student completed a test prep course | Categorical |
| math_score | Score in mathematics (0-100) | Numerical |
| reading_score | Score in reading (0-100) | Numerical |
| writing_score | Score in writing (0-100) | Numerical |
The primary prediction target is the math_score, while analyzing relationships with other scores and features.
Project Overview
The project aims to predict student math scores based on various features including gender, race/ethnicity, parental level of education, lunch type, test preparation course, reading score, and writing score.
Key Features of the Project
Modular Pipeline Architecture
Each component (ingestion, transformation, training, prediction) is implemented as a separate module with clear interfaces, enabling maintainability and extensibility.
Automated Workflow
Complete automation from data ingestion to model deployment, with robust logging and exception handling at each stage to ensure reliability.
Multi-Model Comparison
Evaluation of seven regression algorithms with extensive hyperparameter tuning to find the optimal model for predicting student performance.
Cloud-Native Design
Seamless deployment to Azure Web App service with containerization via Docker, and CI/CD through GitHub Actions.
Problem Statement
The project aims to analyze and predict how student performance (test scores) is affected by various factors such as:
- Gender
- Ethnicity
- Parental level of education
- Lunch type
- Test preparation course
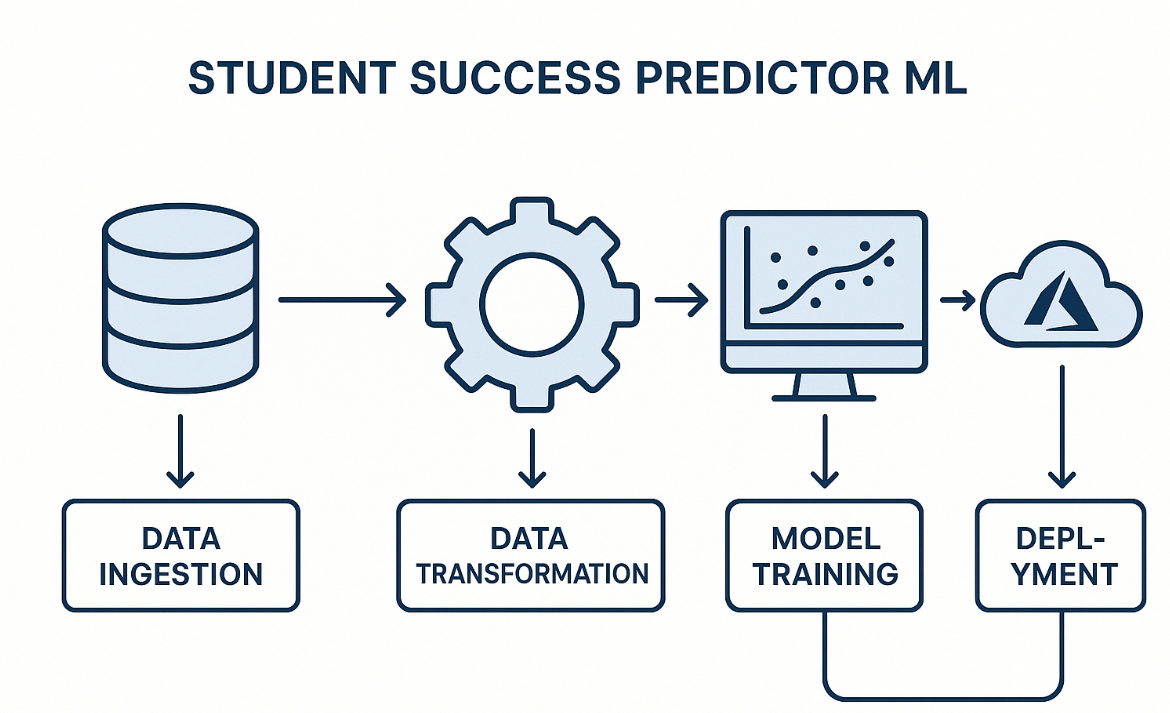
Project Flow Overview
EduML Student Success Predictor Pipeline
- Data Ingestion: Load dataset from CSV file, validate and split into train/test sets
- Data Validation: Verify dataset structure, check distributions and relationships
- Data Transformation: Handle categorical features, apply scaling to numerical features
- Model Training: Benchmark multiple regression models with hyperparameter tuning
- Model Evaluation: Assess performance using R² score, MAE, MSE, and RMSE metrics
- Model Serialization: Save preprocessor and best model for deployment
- Containerization: Package application with Docker for consistent deployment
- CI/CD Pipeline: Automate testing, building, and deployment with GitHub Actions
- Cloud Deployment: Deploy to Azure Web App with appropriate configurations
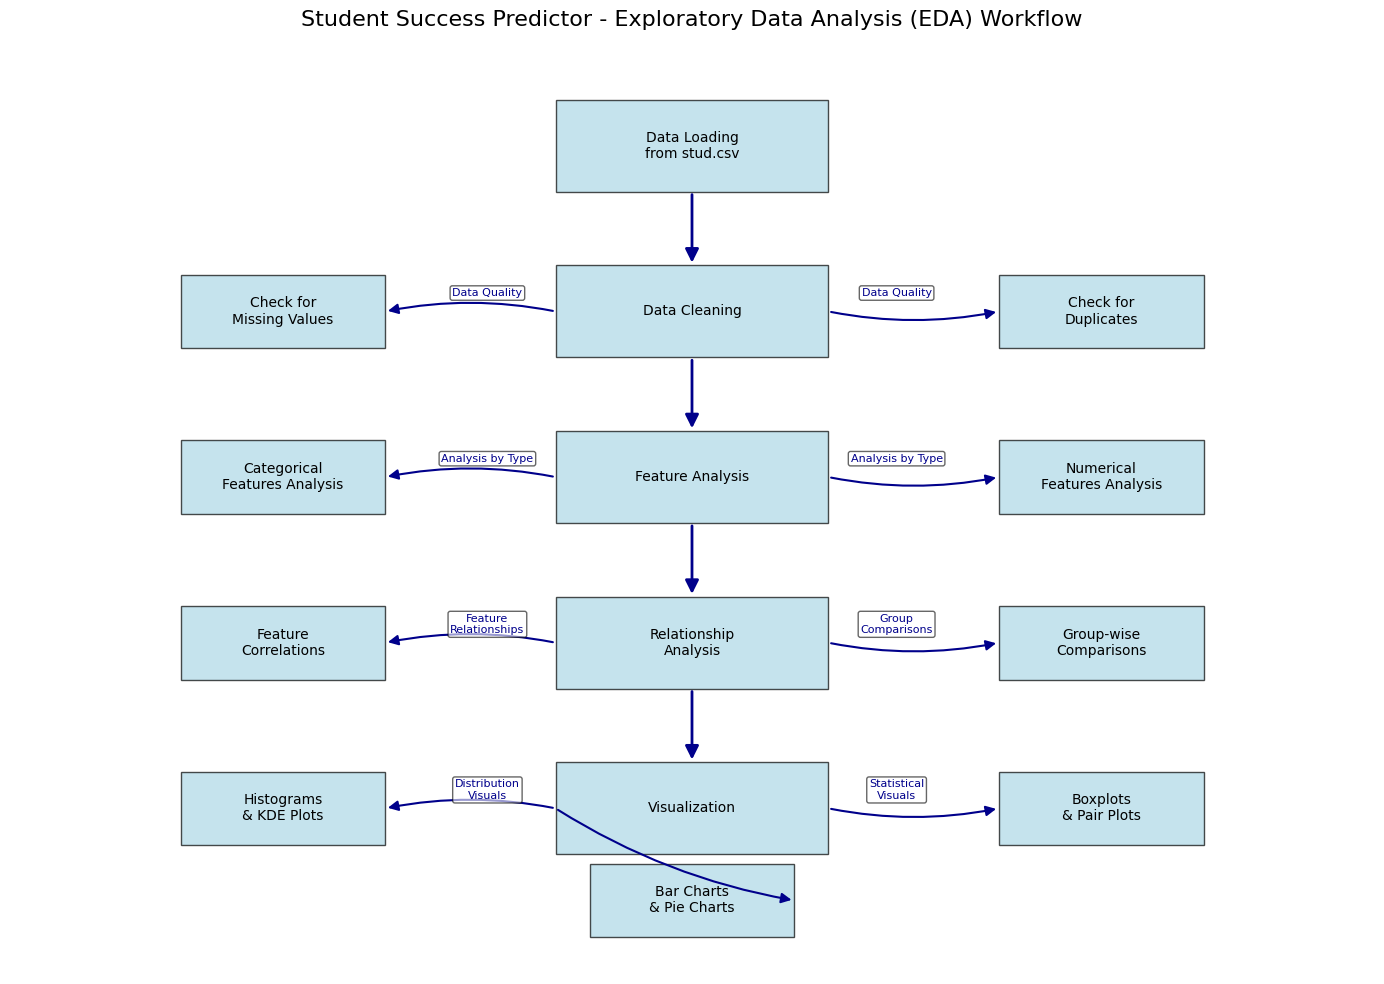
Exploratory Data Analysis (EDA)
The EDA process involved analyzing a dataset of 1,000 students with 8 features to understand the relationships between different variables and their impact on student performance.
Data Quality Checks
Key Findings:
- No missing values in the dataset
- No duplicate records found
- Appropriate data types for all columns
- Reasonable value ranges for all features
Statistical Summary
Basic statistics of numerical features:
| Statistic | Math Score | Reading Score | Writing Score |
|---|---|---|---|
| Mean | 66.09 | 69.17 | 68.05 |
| Std | 15.16 | 14.60 | 15.19 |
| Min | 0.00 | 17.00 | 10.00 |
| Max | 100.00 | 100.00 | 100.00 |
Key Insights from EDA
1. Gender and Performance
- The dataset has nearly balanced gender distribution (48% female, 52% male)
- Female students tend to perform better overall than male students
- Males slightly outperformed females in mathematics specifically
- Females had higher pass rates and were more represented among top scorers
2. Effect of Lunch Type
- Students with standard lunch performed significantly better than those with free/reduced lunch
- This pattern was consistent across both genders
- Suggests socioeconomic factors strongly influence academic performance
3. Impact of Parental Education
- Overall, parental education showed limited impact on student performance
- For male students, having parents with associate's or master's degrees correlated with better performance
- Female student performance showed little correlation with parental education level
4. Ethnic Group Differences
- Group E students scored highest on average across all subjects
- Group A students had the lowest average scores
- Students from Groups A and B performed worse regardless of gender
- Students from lower socioeconomic status had lower averages in all subjects
5. Test Preparation Impact
- Students who completed the test preparation course scored higher in all three categories
- This effect was consistent across demographic groups
- Completing preparation courses appears to be an effective intervention
6. Score Correlations
- Strong positive correlations observed between all three test scores (math, reading, writing)
- Most math scores fell between 60-80
- Most reading and writing scores clustered between 50-80
- All scores increase linearly with each other
EDA Conclusions
The exploratory data analysis identified several key factors affecting student performance:
- Lunch type (a proxy for socioeconomic status) was strongly correlated with performance
- Ethnic group showed significant correlation with test scores
- Test preparation course completion positively impacted scores across all subjects
- Gender differences were observed, with females performing better overall but males slightly better in math
- Parental education showed limited influence, particularly for female students
EDA Workflow Diagram
Data Ingestion
The data ingestion process involves reading the raw dataset, performing initial processing, and splitting it into training and testing sets.
Data Ingestion Workflow
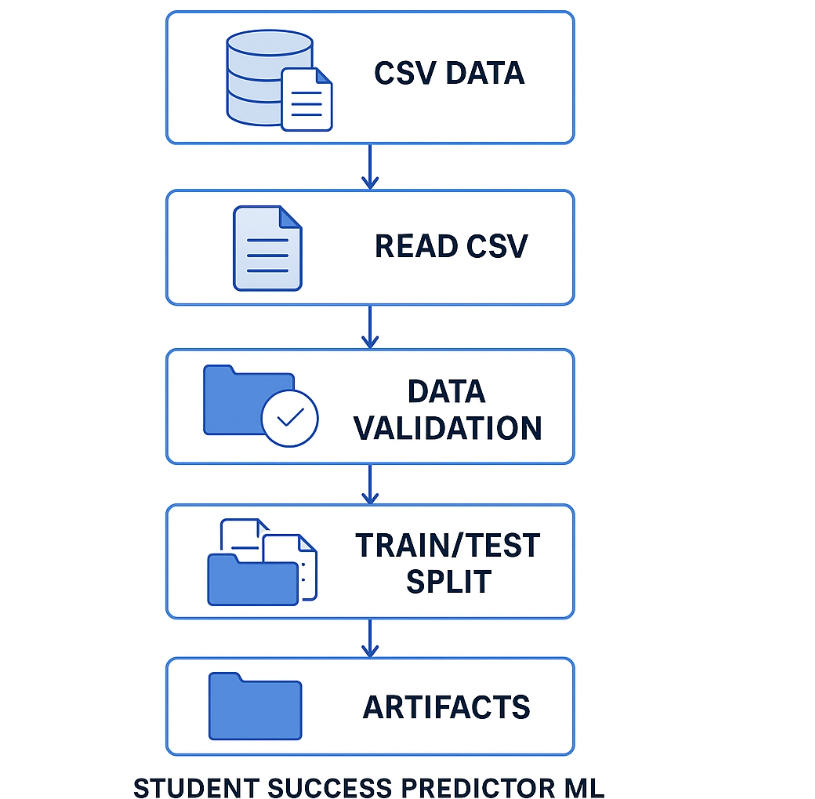
Implementation Details:
- Located in
src/components/data_ingestion.py - Reads the dataset from
notebooks/dataset/stud.csv - Splits the data into training (80%) and testing (20%) sets using
train_test_splitwithrandom_state=42 - Saves the processed datasets as CSV files in the artifacts directory:
artifacts/data.csv- Full datasetartifacts/train.csv- Training splitartifacts/test.csv- Testing split
# Key implementation details
def initiate_data_ingestion(self):
    # Read dataset
    df = pd.read_csv('notebooks/dataset/stud.csv')

    # Create directories
    os.makedirs(os.path.dirname(self.ingestion_config.train_data_path), exist_ok=True)

    # Split dataset
    train_set, test_set = train_test_split(df, test_size=0.2, random_state=42)

    # Save datasets
    train_set.to_csv(self.ingestion_config.train_data_path, index=False, header=True)
    test_set.to_csv(self.ingestion_config.test_data_path, index=False, header=True)

    return self.ingestion_config.train_data_path, self.ingestion_config.test_data_path
Data validation ensures the quality and integrity of the dataset before proceeding to model training.
Validation Checks
- Checking for missing values
- Validating data types
- Ensuring appropriate value ranges
- Checking for duplicates
- Verifying the schema consistency
Data Quality Results:
- No missing values detected
- All data types match expected schema
- All values within valid ranges
- No duplicate records found
- Schema consistent with requirements
Data Transformation
The data transformation process converts raw data into a format suitable for model training, including handling categorical features and scaling numerical values.
Data Transformation Workflow
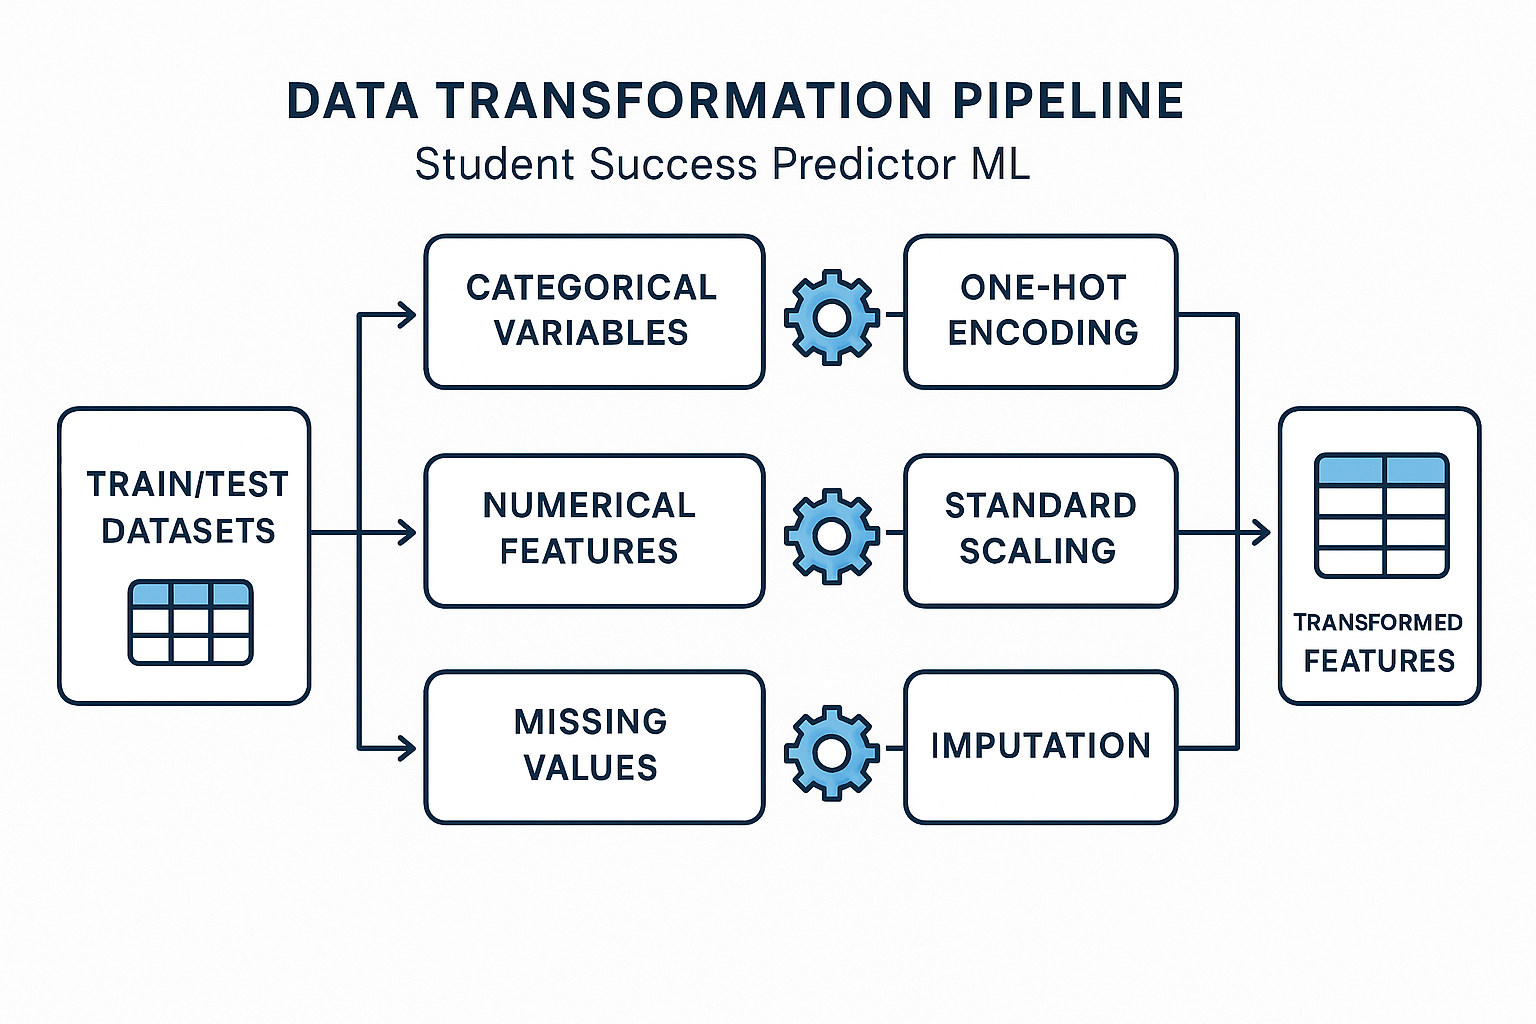
Implementation
The DataTransformation class in src/components/data_transformation.py performs the following:
- Identifying numerical and categorical features
- Creating preprocessing pipelines for both feature types
- Applying One-Hot Encoding for categorical features
- Applying StandardScaler for numerical features
- Combining transformations using ColumnTransformer
- Saving the preprocessor for later use in prediction
# Key implementation details
def get_data_transformer_object(self):
    # Define numerical and categorical features
    numerical_columns = ["writing_score", "reading_score"]
    categorical_columns = [
        "gender",
        "race_ethnicity",
        "parental_level_of_education",
        "lunch",
        "test_preparation_course",
    ]

    # Create preprocessing pipelines
    num_pipeline = Pipeline(
        steps=[
            ("scaler", StandardScaler())
        ]
    )

    cat_pipeline = Pipeline(
        steps=[
            ("one_hot_encoder", OneHotEncoder()),
            ("scaler", StandardScaler(with_mean=False))
        ]
    )

    # Combine pipelines using ColumnTransformer
    preprocessor = ColumnTransformer(
        [
            ("num_pipeline", num_pipeline, numerical_columns),
            ("cat_pipeline", cat_pipeline, categorical_columns)
        ]
    )

    return preprocessor

def initiate_data_transformation(self, train_path, test_path):
    # Load train and test data
    train_df = pd.read_csv(train_path)
    test_df = pd.read_csv(test_path)

    # Get preprocessor object
    preprocessing_obj = self.get_data_transformer_object()

    # Define target column
    target_column_name = "math_score"

    # Split into features and target
    input_feature_train_df = train_df.drop(columns=[target_column_name], axis=1)
    target_feature_train_df = train_df[target_column_name]

    input_feature_test_df = test_df.drop(columns=[target_column_name], axis=1)
    target_feature_test_df = test_df[target_column_name]

    # Apply transformations
    input_feature_train_arr = preprocessing_obj.fit_transform(input_feature_train_df)
    input_feature_test_arr = preprocessing_obj.transform(input_feature_test_df)

    # Convert to arrays for modeling
    train_arr = np.c_[input_feature_train_arr, np.array(target_feature_train_df)]
    test_arr = np.c_[input_feature_test_arr, np.array(target_feature_test_df)]

    # Save preprocessor object
    save_object(
        file_path=self.data_transformation_config.preprocessor_obj_file_path,
        obj=preprocessing_obj
    )

    return train_arr, test_arr, self.data_transformation_config.preprocessor_obj_file_path
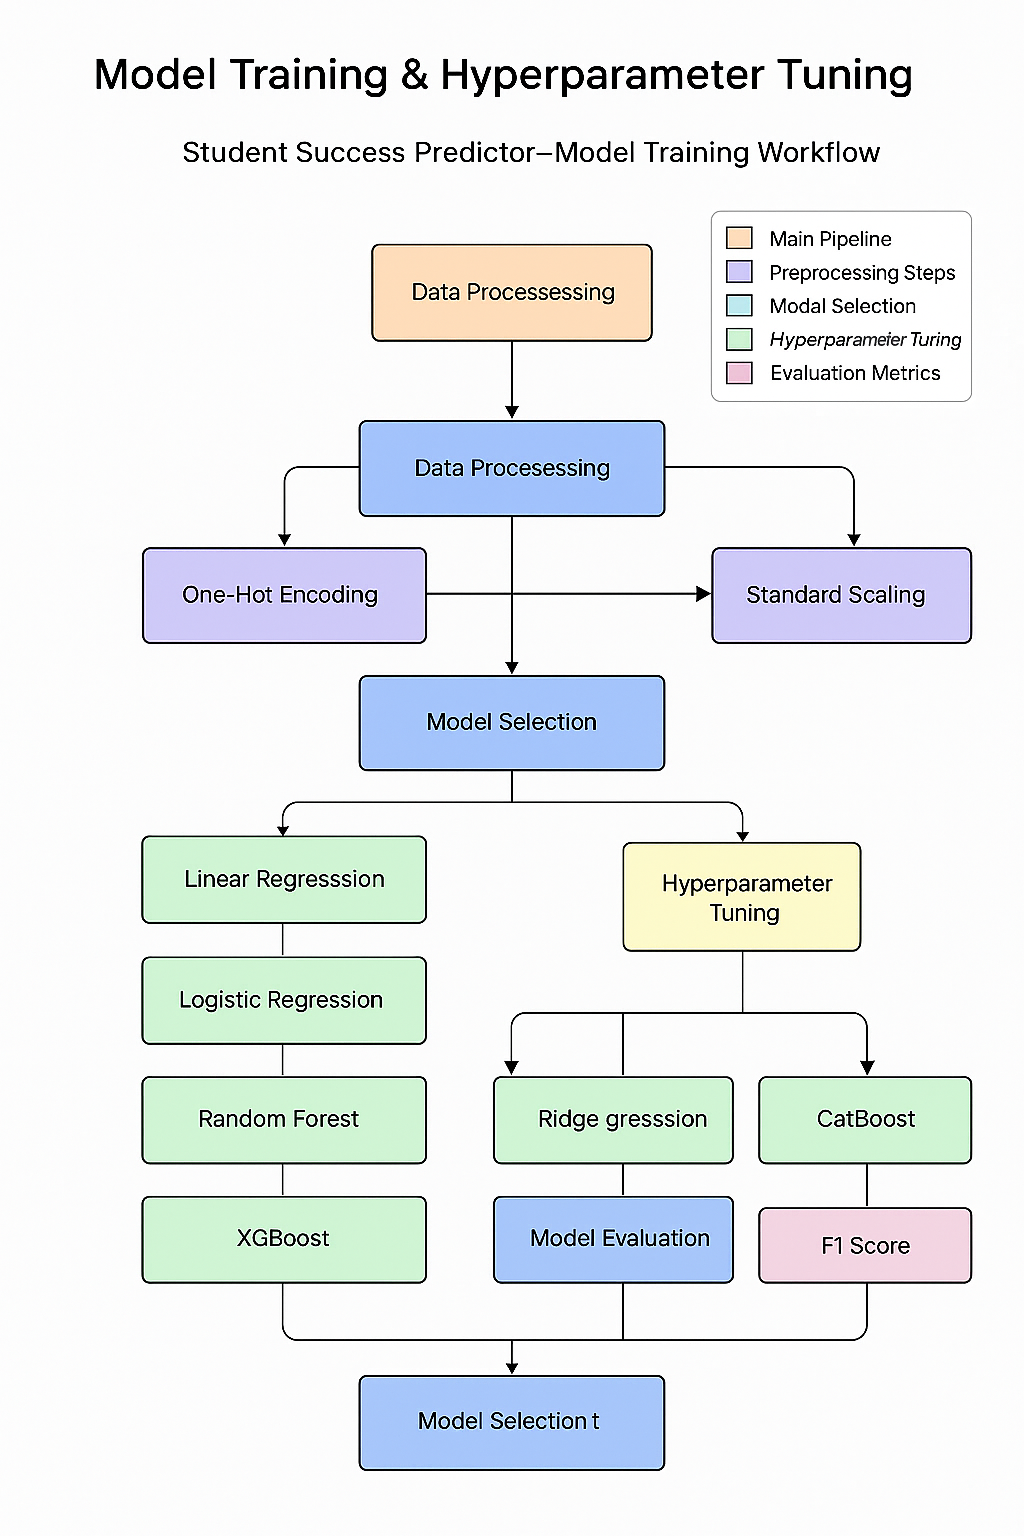
Model Training & Hyperparameter Tuning
The model training process involves evaluating multiple regression algorithms and selecting the best performing model through hyperparameter tuning.
Model Selection Strategy
The project employs a comprehensive approach to model selection, evaluating seven different regression algorithms with rigorous hyperparameter tuning to find the optimal predictor for student math scores.
Candidate Models
Linear Regression
A simple baseline model that assumes a linear relationship between features and target.
Random Forest Regressor
Ensemble of decision trees that handles non-linear relationships and feature interactions well.
Tuned parameters: n_estimators
Decision Tree Regressor
Single decision tree offering good interpretability and feature importance rankings.
Tuned parameters: criterion
Gradient Boosting Regressor
Sequential ensemble method that builds trees to correct errors of previous trees.
Tuned parameters: learning_rate, subsample, n_estimators
XGBoost Regressor
Advanced gradient boosting implementation known for high performance and speed.
Tuned parameters: learning_rate, n_estimators
CatBoost Regressor
Gradient boosting algorithm that handles categorical features effectively.
Tuned parameters: depth, iterations, learning_rate
AdaBoost Regressor
Boosting algorithm that weights misclassified samples higher in subsequent iterations.
Tuned parameters: learning_rate, n_estimators
Training Process
The model training process is implemented in src/components/model_trainer.py. The key steps include:
- Splitting preprocessed data into features (X) and target (y) for both training and testing sets
- Initializing multiple regression models with default parameters
- Training each model on the training data
- Evaluating model performance on both training and testing sets
- Selecting the best model based on R² score on the test set
- Saving the best model as
artifacts/model.pkl
Implementation
The ModelTrainer class in src/components/model_trainer.py handles model training and selection:
# Key implementation details
def initiate_model_trainer(self, train_array, test_array):
    try:
        # Split arrays into features and target
        X_train, y_train, X_test, y_test = (
            train_array[:,:-1],
            train_array[:,-1],
            test_array[:,:-1],
            test_array[:,-1]
        )

        # Define models to evaluate
        models = {
            "Random Forest": RandomForestRegressor(),
            "Decision Tree": DecisionTreeRegressor(),
            "Gradient Boosting": GradientBoostingRegressor(),
            "Linear Regression": LinearRegression(),
            "XGBRegressor": XGBRegressor(),
            "CatBoosting Regressor": CatBoostRegressor(verbose=False),
            "AdaBoost Regressor": AdaBoostRegressor(),
        }

        # Define hyperparameter grids
        params = {
            "Decision Tree": {
                'criterion': ['squared_error', 'friedman_mse', 'absolute_error', 'poisson'],
                'splitter': ['best', 'random'],
                'max_features': ['sqrt', 'log2'],
            },
            "Random Forest": {
                'n_estimators': [8, 16, 32, 64, 128, 256],
                'criterion': ['squared_error', 'absolute_error'],
                'max_features': ['sqrt', 'log2'],
            },
            "Gradient Boosting": {
                'learning_rate': [.1, .01, .05, .001],
                'subsample': [0.6, 0.7, 0.75, 0.8, 0.85, 0.9],
                'n_estimators': [8, 16, 32, 64, 128, 256]
            },
            "Linear Regression": {},
            "XGBRegressor": {
                'learning_rate': [.1, .01, .05, .001],
                'n_estimators': [8, 16, 32, 64, 128, 256]
            },
            "CatBoosting Regressor": {
                'depth': [6, 8, 10],
                'learning_rate': [0.01, 0.05, 0.1],
                'iterations': [30, 50, 100]
            },
            "AdaBoost Regressor": {
                'learning_rate': [.1, .01, 0.5, .001],
                'n_estimators': [8, 16, 32, 64, 128, 256]
            }
        }

        # Evaluate models
        model_report = evaluate_models(
            X_train=X_train,
            y_train=y_train,
            X_test=X_test,
            y_test=y_test,
            models=models,
            param=params
        )

        # Get the best model
        best_model_score = max(sorted(model_report.values()))
        best_model_name = list(model_report.keys())[
            list(model_report.values()).index(best_model_score)
        ]
        best_model = models[best_model_name]

        # Save the best model
        save_object(
            file_path=self.model_trainer_config.trained_model_file_path,
            obj=best_model
        )

        return best_model_name, best_model_score
    except Exception as e:
        raise CustomException(e, sys)
Hyperparameter Tuning
The project uses GridSearchCV to find the optimal hyperparameters for each model:
Key Hyperparameters by Model:
- Decision Tree: criterion, splitter, max_features
- Random Forest: n_estimators, criterion, max_features
- Gradient Boosting: learning_rate, subsample, n_estimators
- XGBoost: learning_rate, n_estimators
- CatBoost: depth, learning_rate, iterations
- AdaBoost: learning_rate, n_estimators
Model Training Results
After evaluation, the models showed the following performance (R² Score):
| Model | R² Score |
|---|---|
| Ridge | 0.880593 |
| Linear Regression | 0.880345 |
| CatBoosting Regressor | 0.851632 |
| AdaBoost Regressor | 0.849847 |
| Random Forest Regressor | 0.847291 |
| Lasso | 0.825320 |
| XGBRegressor | 0.821589 |
| K-Neighbors Regressor | 0.783813 |
| Decision Tree | 0.760313 |
Best Model Selection
After evaluating all models with their optimal hyperparameters, the best performing model is selected based on the R² score on the test set. This model is then saved for deployment in the prediction pipeline.
# Find best model
best_model_score = max(sorted(model_report.values()))
best_model_name = list(model_report.keys())[list(model_report.values()).index(best_model_score)]
best_model = models[best_model_name]

if best_model_score < 0.6:
    raise CustomException("No best model found")

logging.info(f"Best found model on both training and testing dataset: {best_model_name}")

save_object(
    file_path=self.model_trainer_config.trained_model_file_path,
    obj=best_model
)
Model Training & Hyperparameter Tuning Workflow
Model Definition
Parameter Grid Definition
Cross-Validation
Model Evaluation
Best Model Selection
Model Serialization
Model Evaluation
The model evaluation process involved assessing the performance of each model using multiple metrics.
Evaluation Metrics
- R² Score: Measures the proportion of variance in the dependent variable explained by the independent variables
- Mean Absolute Error (MAE): Average of absolute differences between predicted and actual values
- Root Mean Squared Error (RMSE): Square root of the average of squared differences between predicted and actual values
Best Model Performance:
Ridge Regression achieved the highest R² Score of 0.88, indicating that it explains 88% of the variance in math scores.
Cross-Validation
Cross-validation was performed to ensure the model's robustness and generalization capability.
Experiment Tracking
The project includes experiment tracking to monitor the training process and model performance.
CatBoost Info Directory
The catboost_info/ directory contains logs and metrics from CatBoost training:
catboost_training.json: Training parameters and configurationlearn_error.tsv: Training errors across iterationstime_left.tsv: Time estimation logsevents.out.tfevents: TensorBoard compatible event files
While this project doesn't explicitly implement a dedicated experiment tracking system like MLflow or Weights & Biases, it employs structured logging and artifact management to track model development:
Logging System
A custom logging module records all steps in the machine learning pipeline, capturing information about data processing, model training, and evaluation metrics. This creates a historical record of the model development process.
import logging
import os
from datetime import datetime

LOG_FILE = f"{datetime.now().strftime('%m_%d_%Y_%H_%M_%S')}.log"
logs_path = os.path.join(os.getcwd(), "logs", LOG_FILE)
os.makedirs(logs_path, exist_ok=True)

LOG_FILE_PATH = os.path.join(logs_path, LOG_FILE)

logging.basicConfig(
    filename=LOG_FILE_PATH,
    format="[ %(asctime)s ] %(lineno)d %(name)s - %(levelname)s - %(message)s",
    level=logging.INFO,
)
Model Persistence
Trained models and preprocessing objects are serialized and saved in the artifacts directory. This ensures that each model version can be retrieved and compared with other versions over time.
def save_object(file_path, obj):
    try:
        dir_path = os.path.dirname(file_path)
        os.makedirs(dir_path, exist_ok=True)

        with open(file_path, "wb") as file_obj:
            dill.dump(obj, file_obj)

    except Exception as e:
        raise CustomException(e, sys)
Performance Tracking
Model performance metrics are logged for each trained model, allowing for comparison between different algorithms and hyperparameter configurations. This information guides the selection of the best model for deployment.
Deployment
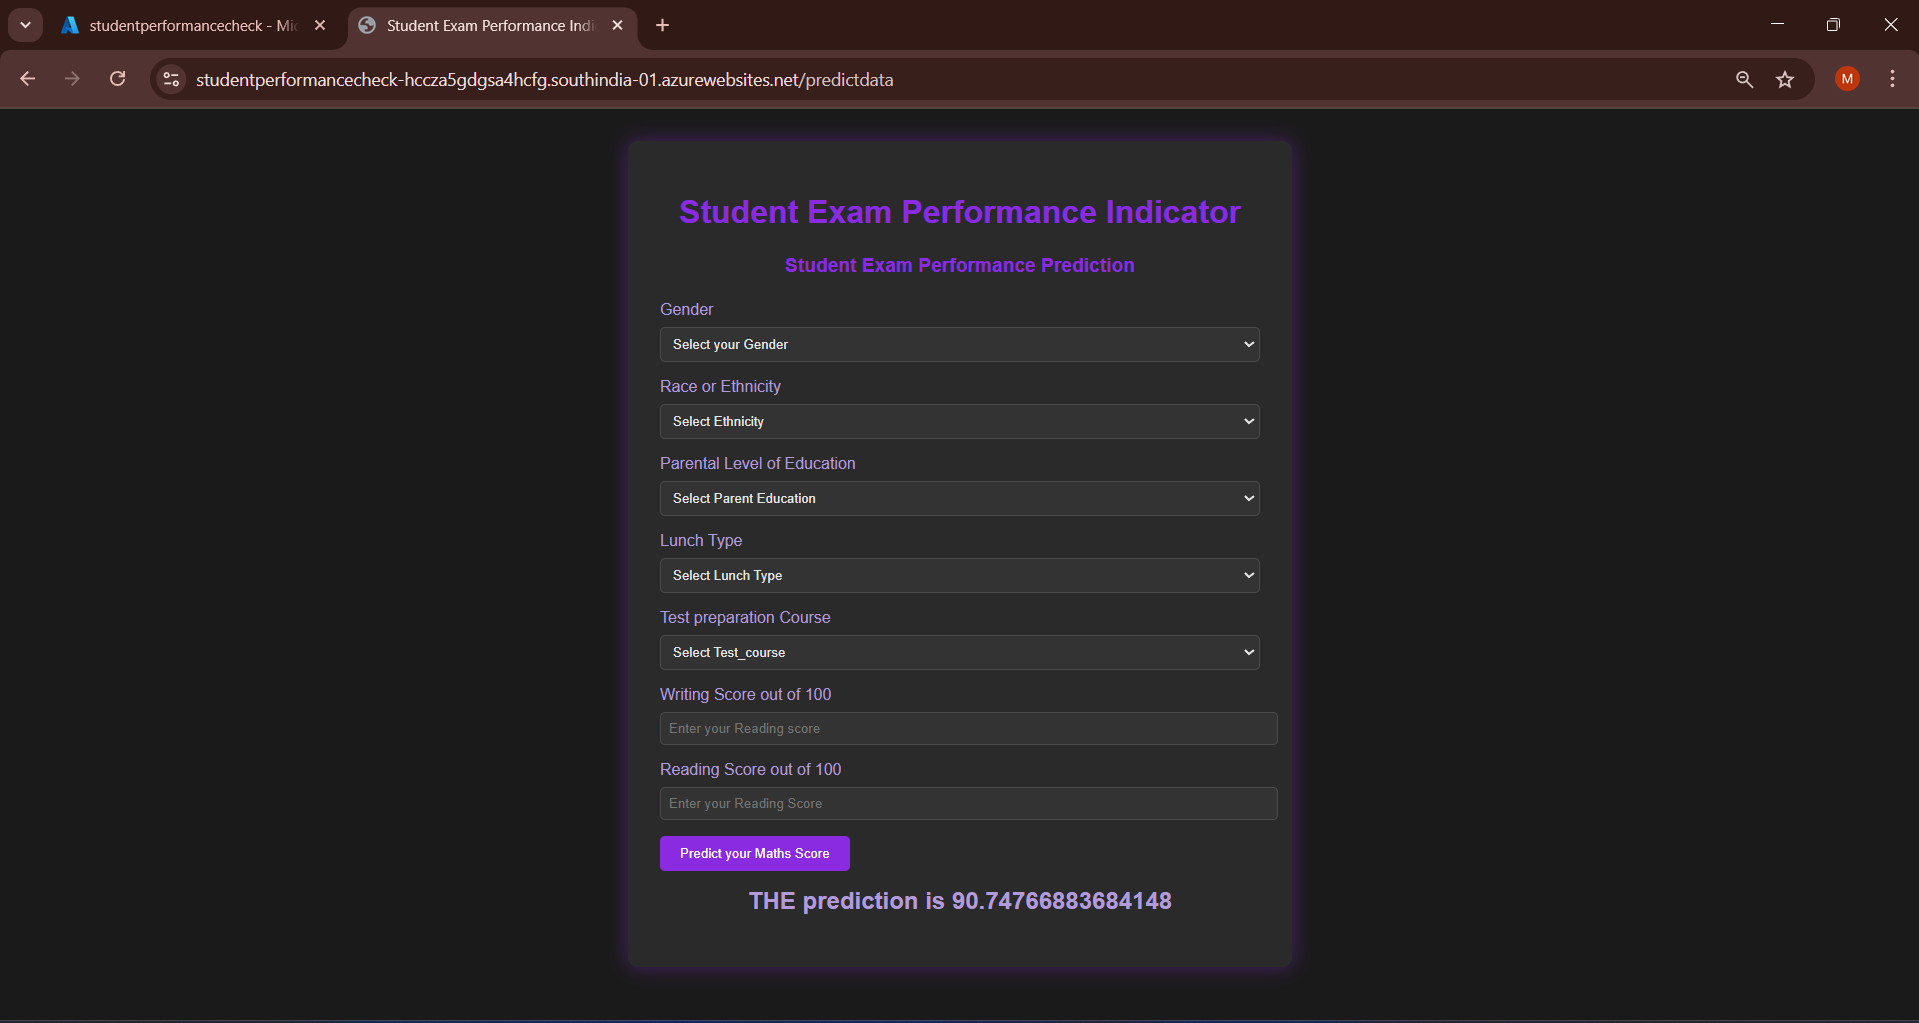
The model was deployed as a web application using Flask, allowing users to input student information and receive predicted math scores.
Flask Web Application
The app.py file sets up a Flask application with the following features:
- Home page with an introduction
- Prediction form for user input
- RESTful endpoint for receiving prediction requests
- Integration with the prediction pipeline
# Key implementation details from app.py
from flask import Flask, request, render_template
import numpy as np
import pandas as pd

from sklearn.preprocessing import StandardScaler
from src.pipeline.predict_pipeline import CustomData, PredictPipeline

application = Flask(__name__)
app = application

@app.route('/')
def index():
    return render_template('index.html')

@app.route('/predictdata', methods=['GET', 'POST'])
def predict_datapoint():
    if request.method == 'GET':
        return render_template('home.html')
    else:
        data = CustomData(
            gender=request.form.get('gender'),
            race_ethnicity=request.form.get('ethnicity'),
            parental_level_of_education=request.form.get('parental_level_of_education'),
            lunch=request.form.get('lunch'),
            test_preparation_course=request.form.get('test_preparation_course'),
            reading_score=float(request.form.get('writing_score')),
            writing_score=float(request.form.get('reading_score'))
        )
        pred_df = data.get_data_as_data_frame()

        predict_pipeline = PredictPipeline()
        results = predict_pipeline.predict(pred_df)

        return render_template('home.html', results=results[0])

if __name__ == "__main__":
    app.run(host="0.0.0.0", port=80)
Prediction Pipeline
The src/pipeline/predict_pipeline.py file implements the prediction functionality:
- Loading the trained model and preprocessor
- Processing user input
- Generating predictions
Docker Containerization
The application was containerized using Docker for consistent deployment across environments.
Dockerfile
FROM python:3.9-slim
WORKDIR /app
COPY . /app
RUN apt update -y
RUN apt-get update && pip install -r requirements.txt
CMD ["python3", "app.py"]
The Dockerfile specifies:
- Python 3.9 slim as the base image
- Setting the working directory to /app
- Copying all project files to the container
- Installing dependencies from requirements.txt
- Running the Flask application
.dockerignore
The .dockerignore file excludes unnecessary files from the Docker build context:
venv
.git
__pycache__
*.log
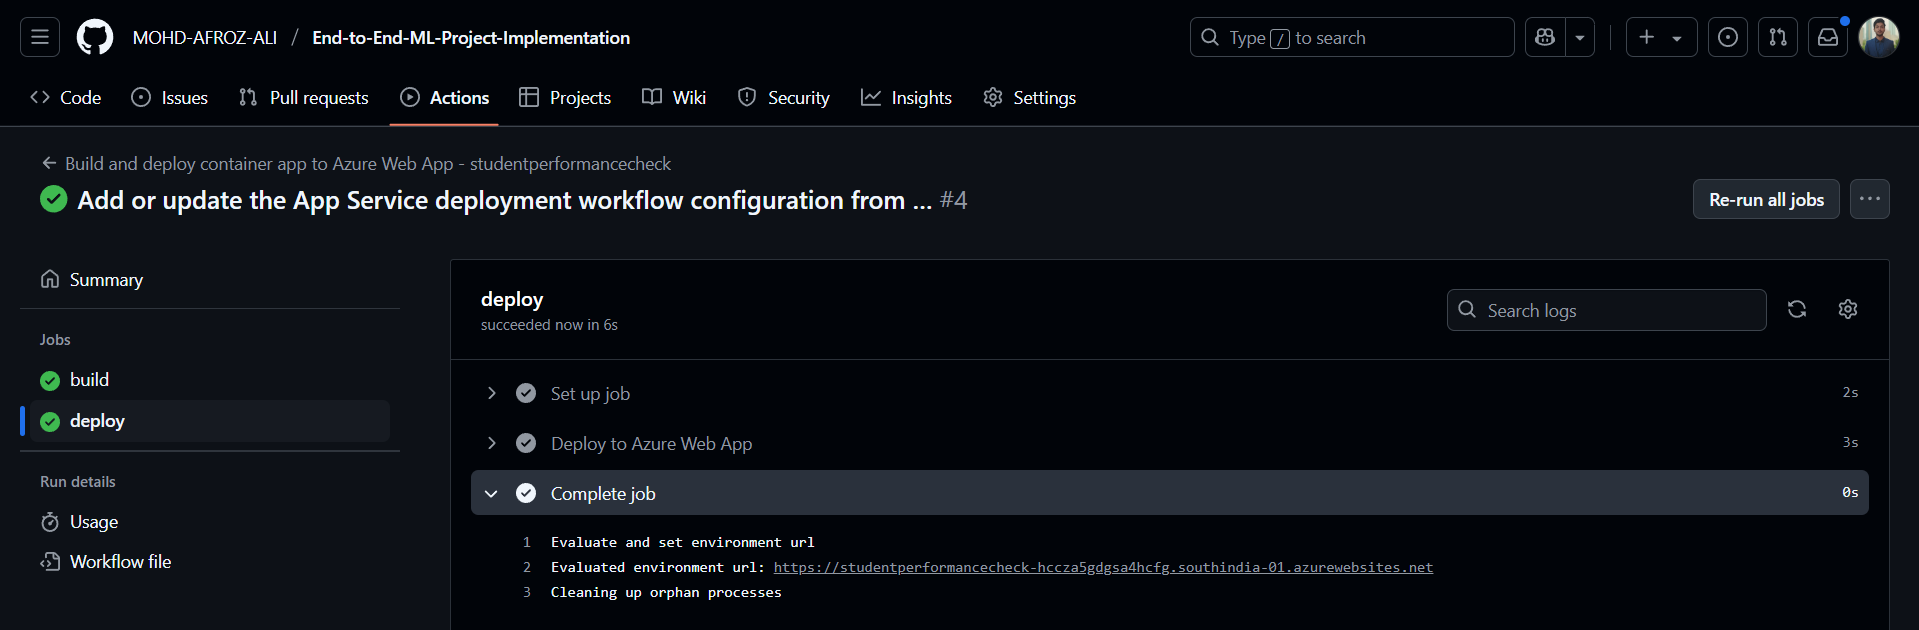
CI/CD Pipeline
The project implements a CI/CD pipeline using GitHub Actions to automate the build and deployment process.
GitHub Actions Workflow
The CI/CD pipeline is defined in .github/workflows/main_studentperformancecheck.yml and includes the following steps:
Workflow Trigger:
- Automatically triggered on push to the main branch
- Can also be manually triggered using workflow_dispatch
Build Job:
- Checkout repository code
- Set up Docker Buildx for multi-platform builds
- Log in to Azure Container Registry using secrets
- Build Docker image from Dockerfile
- Push the image to Azure Container Registry with a tag based on the commit SHA
Deploy Job:
- Run after the build job completes
- Deploy to Azure Web App using the azure/webapps-deploy action
- Configure the deployment with app name, slot, and authentication details
- Specify the Docker image to deploy from Azure Container Registry
name: Build and deploy container app to Azure Web App - studentperformancecheck

on:
  push:
    branches:
      - main
  workflow_dispatch:

jobs:
  build:
    runs-on: 'ubuntu-latest'
    steps:
    - uses: actions/checkout@v2
    - name: Set up Docker Buildx
      uses: docker/setup-buildx-action@v2
    - name: Log in to registry
      uses: docker/login-action@v2
      with:
        registry: https://testdockerafroz.azurecr.io/
        username: ${{ secrets.AzureAppService_ContainerUsername_f24c206db1e145f79bfb160d64f62f1d }}
        password: ${{ secrets.AzureAppService_ContainerPassword_2f191264d14048f9979084413f811090 }}
    - name: Build and push container image to registry
      uses: docker/build-push-action@v3
      with:
        push: true
        tags: testdockerafroz.azurecr.io/${{ secrets.AzureAppService_ContainerUsername_f24c206db1e145f79bfb160d64f62f1d }}/studentperformance1:${{ github.sha }}
        file: ./Dockerfile

  deploy:
    runs-on: ubuntu-latest
    needs: build
    environment:
      name: 'production'
      url: ${{ steps.deploy-to-webapp.outputs.webapp-url }}
    steps:
    - name: Deploy to Azure Web App
      id: deploy-to-webapp
      uses: azure/webapps-deploy@v2
      with:
        app-name: 'studentperformancecheck'
        slot-name: 'production'
        publish-profile: ${{ secrets.AzureAppService_PublishProfile_a291bb02fa174668a5f7d1ca7a8cc164 }}
        images: 'testdockerafroz.azurecr.io/${{ secrets.AzureAppService_ContainerUsername_f24c206db1e145f79bfb160d64f62f1d }}/studentperformance1:${{ github.sha }}'
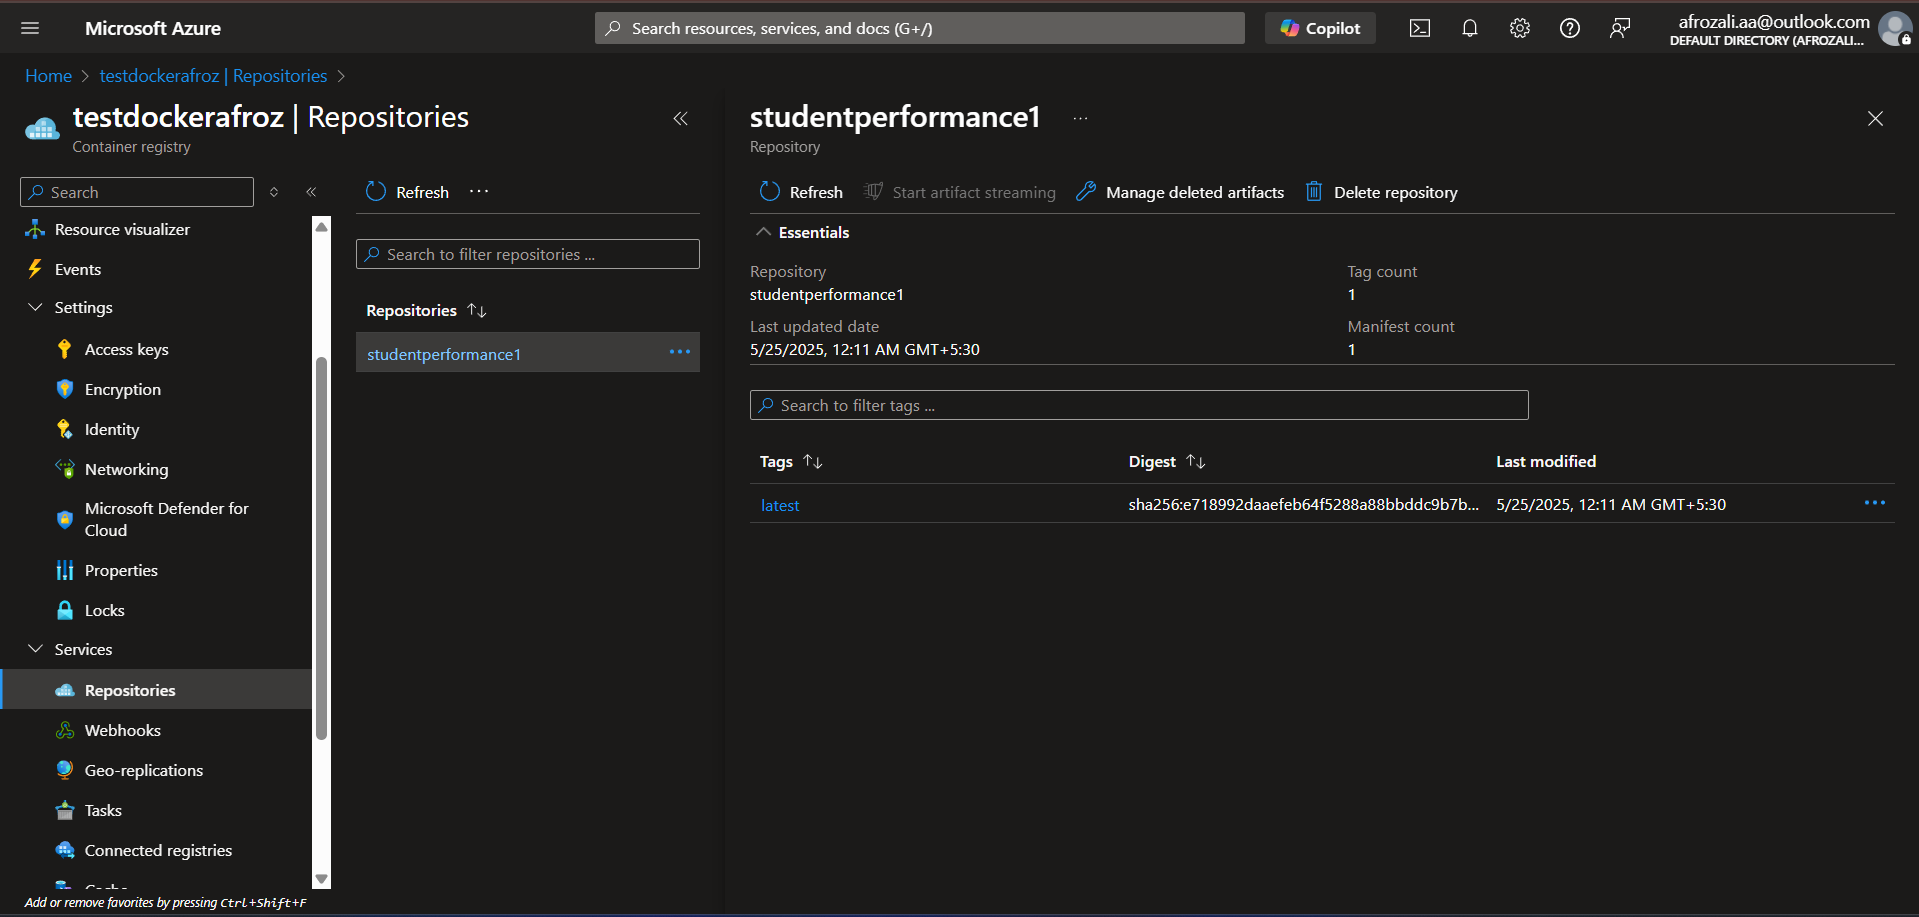
Cloud Deployment (Azure)
The application is deployed on Azure using Azure Web App and Azure Container Registry.
Azure Services Used
Azure Container Registry (ACR)
Hosts Docker images built by the CI/CD pipeline, providing version control and secure storage for container images.
Azure Web App
Hosts the containerized application, providing a fully managed platform for running the prediction service with automatic scaling and high availability.
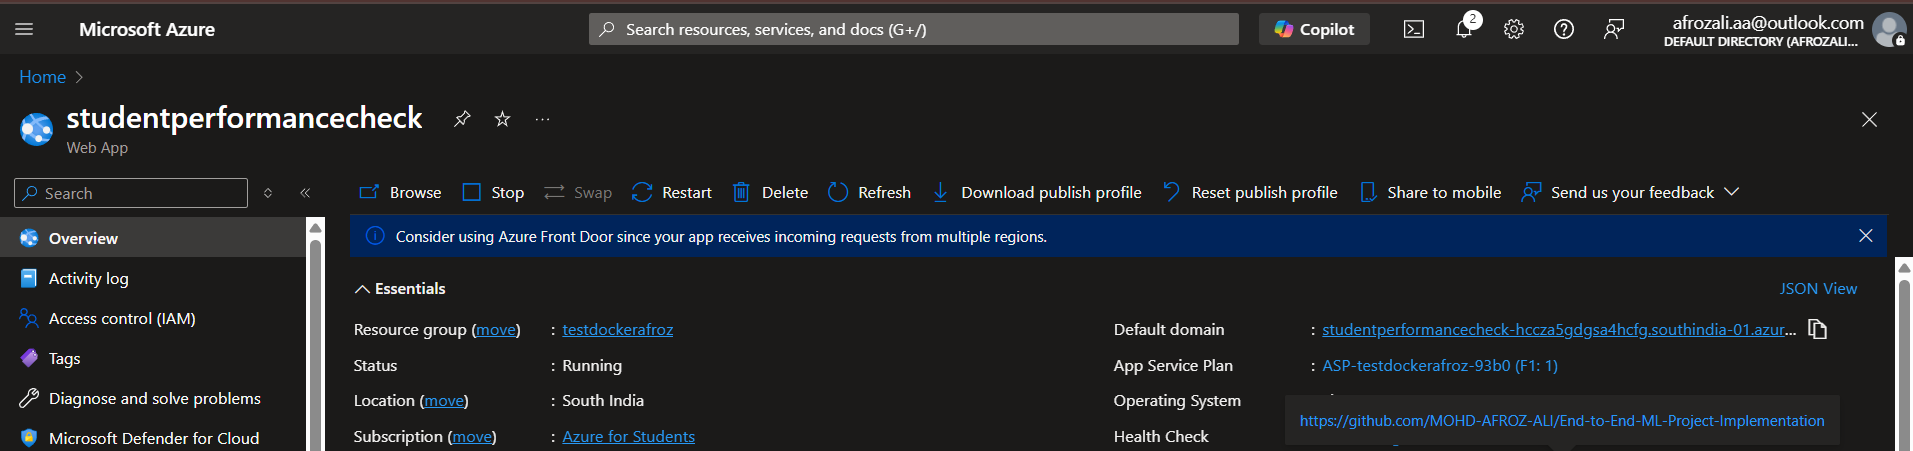
Azure Deployed webpage
Hosted the containerized application, providing a fully managed platform for running the prediction service with automatic scaling and high availability.
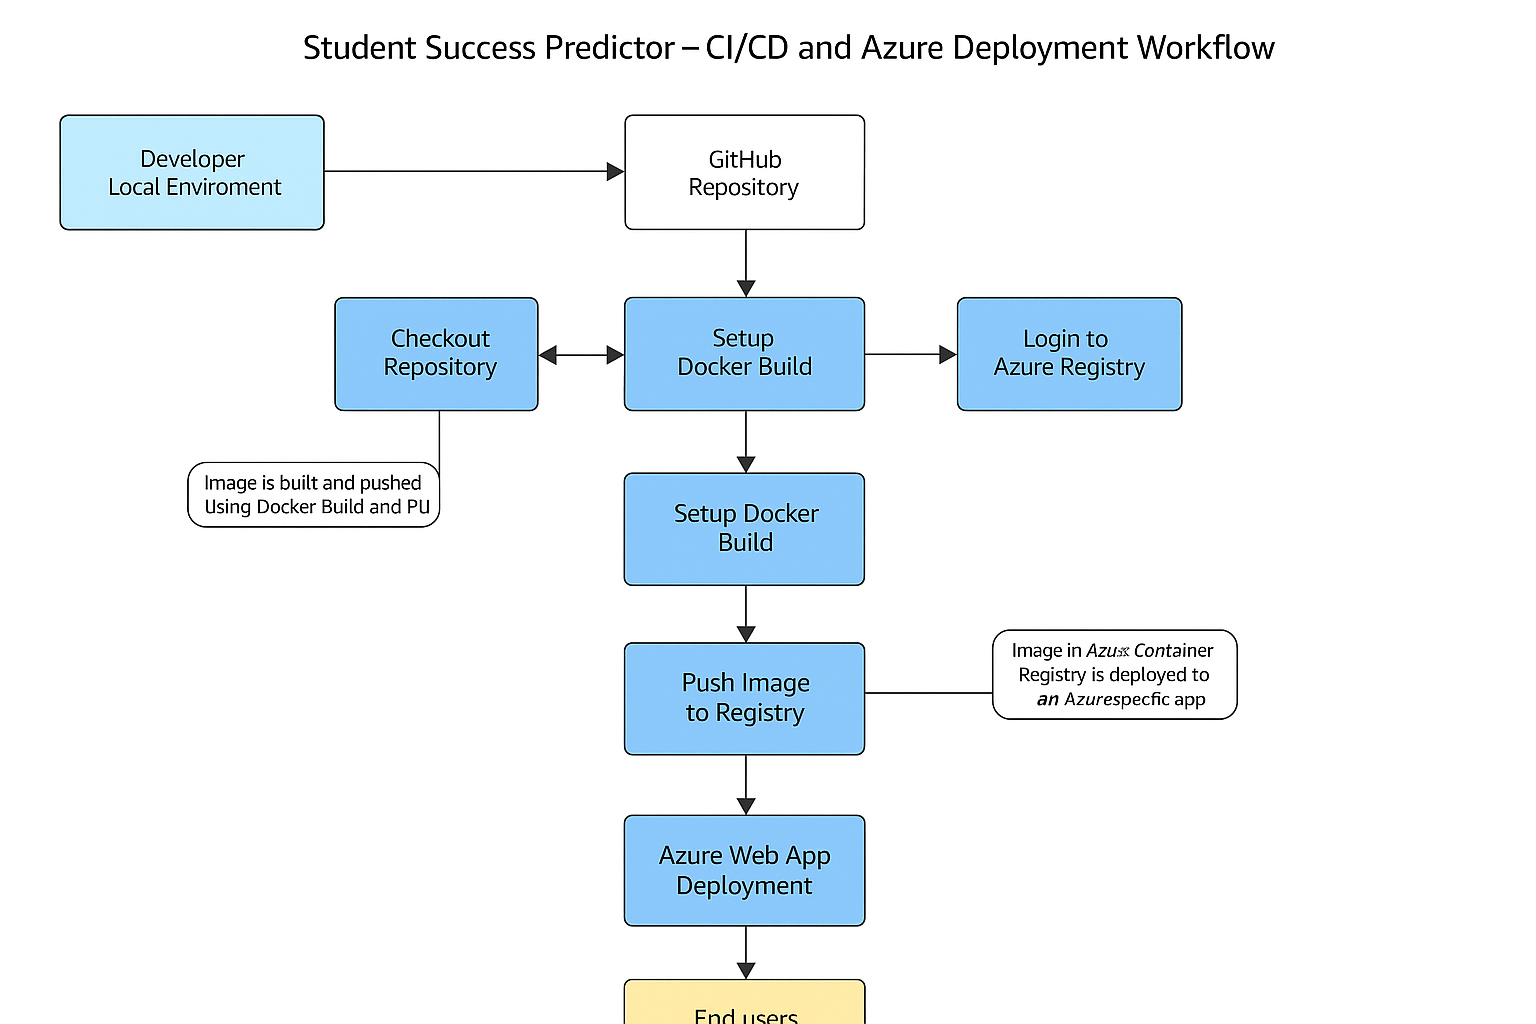
Deployment Architecture
The deployment architecture follows these steps:
- Docker image is built and pushed to Azure Container Registry
- Azure Web App pulls the Docker image from the registry
- Web App runs the container and exposes the application
- The application is accessible via the URL provided by Azure Web App
Azure Deployment Workflow
GitHub Repository
GitHub Actions
Docker Image
Azure Container Registry
Azure Web App
Production Deployment
Security Considerations:
- Secrets and credentials stored securely in GitHub repository secrets
- Azure publish profile used for secure deployment
- Container registry authentication required for accessing images
Conclusion
The Student Success Predictor project successfully demonstrates an end-to-end machine learning pipeline, from exploratory data analysis to model deployment in production.
Key Achievements
- Comprehensive EDA revealing factors affecting student performance
- Modular implementation of data processing and model training components
- Evaluation of multiple regression models with hyperparameter tuning
- Achieving 88% accuracy (R² Score) with Ridge Regression
- Web application development with Flask for user-friendly predictions
- Containerization with Docker for reproducibility
- Automated CI/CD pipeline using GitHub Actions
- Cloud deployment on Azure for scalability and accessibility
Key Insights
The project provided several valuable insights:
- Student performance is strongly influenced by socioeconomic factors (as indicated by lunch type)
- Test preparation courses significantly improve performance across all subjects
- There are gender differences in performance, with females generally performing better overall but males slightly better in mathematics
- Linear models (Ridge and Linear Regression) outperformed more complex models for this prediction task
- Reading and writing scores are strong predictors of math scores
Future Improvements
- Collecting more data to improve model generalization
- Implementing more advanced feature engineering techniques
- Exploring deeper neural network architectures
- Adding monitoring and feedback mechanisms
- Implementing A/B testing for model improvements
Skills Showcased
Data Science
- Exploratory Data Analysis
- Data Preprocessing
- Feature Engineering
- Machine Learning Modeling
- Model Evaluation & Validation
- Hyperparameter Tuning
Software Engineering
- Object-Oriented Programming
- Modular Code Design
- Python Development
- Web Application Development
- API Development
- Error Handling & Logging
DevOps & MLOps
- Containerization with Docker
- CI/CD Pipeline Implementation
- Cloud Deployment
- Version Control with Git
- Artifact Management
- Model Deployment
Tools & Technologies
- Python (Pandas, NumPy, Scikit-learn)
- Machine Learning Libraries (XGBoost, CatBoost)
- Flask Web Framework
- Docker
- GitHub Actions
- Azure Cloud Services
GitHub & Contact Details
Project Repository
Contact Information
- Email: afrozali3001.aa@gmail.com
- Phone: +91 9959786710
- LinkedIn: linkedin.com/in/mohd-afroz-ali